Itaú needed a smarter
way to manage work
Itaú Unibanco, one of the largest banks in Latin America, relied on Jira as the primary task management tool across all its teams — used by over 17,000 employees. But Jira came with a steep price tag and an even steeper learning curve. Leadership wanted to reduce tooling costs while improving the daily experience for the employees who depended on it.
Even as a Product Design Manager, I had to be hands-on for this product, so I led the end-to-end design process for this specific product — keeping it scalable, affordable, and genuinely loved by the people using it.
What I set out to do
Create an easier and cost-effective task management tool to replace Jira across Itaú Unibanco.
Develop a customized solution that meets specific user needs and integrates into existing workflows.
Improve productivity, collaboration, and overall experience while working on projects through IU Click Pocket.
How I approached it
What the numbers revealed
A mixed-methods approach — combining survey responses from 500+ employees with behavioral data from Jira — painted a clear picture of the problem.
Who are the users? Internal Itaú bank employees — not external customers. These are the product and tech teams building and shipping products inside the bank every day. All decisions were designed for them.
Jira, in their own words
Participants were selected based on regular Jira usage. Their feedback went beyond surface complaints — they described friction quietly eroding productivity every single day.
"Jira's usability is unnecessarily difficult. Challenging — but nothing that can't be overcome with time and practice."
"The team only uses the board day-to-day, but the Jira board alone isn't sufficient — we use other methods to track deliveries."
"Creating issues is easy. The problem is understanding the impact on the product and measuring business evolution post-delivery."
Market benchmarking
We mapped the landscape to understand what the market offered, where gaps existed, and what we could improve for Itaú's specific context.
Who I designed for
Two distinct user archetypes emerged from our research — a technically-oriented team lead and a non-technical business analyst — each with very different mental models around task management.

Alex leads an Agile development team and is responsible for overseeing new feature delivery and ensuring the team meets project deadlines. He has experience with various project management platforms and is always on the lookout for more efficient solutions.
- Improve team productivity and efficiency
- Streamline the project management process
- Keep the team aligned with deadlines
- Stay current with PM frameworks and tools
- Managing developers with different skill levels and styles
- Balancing agility with structure and process
- Keeping the team motivated throughout delivery
- Tools that make the job easier and faster
- Processes that help the team work better together
- Growing as a tech lead
"I love being able to track all of our work in Jira and sometimes it can be overwhelming trying to keep everything up to date and organized. It's like a never ending game of Tetris!"

Sarah is a Financial Analyst at a large corporation. She is responsible for managing the financial data for several different departments and ensuring that budgets are met. Sarah has experience using various financial management tools, but she is always looking for ways to improve her workflow.
- Improve the financial management process
- Make more accurate financial forecasts
- Keep budgets and expenses under control
- Improve collaboration across departments
- Managing large volumes of financial data accurately
- Keeping up with changing compliance standards
- Ensuring all departments follow the same guidelines
- Tools that simplify financial data management
- Solutions that improve cross-team communication
- Staying current on financial management trends
"I appreciate the structure that Jira brings to our team's workflow, but I often feel like it's geared more towards developers and doesn't take into account the unique needs of our department. That's why I prefer Trello."
Task Mapping
We mapped every user touchpoint with the existing Jira flow to understand the full journey — from opening the platform to viewing progress reports — and identify exactly where friction was introduced.
| Task | User Goal | Description |
|---|---|---|
| Open Jira | Access the platform | User opens Jira on their device |
| Login | Access the platform | User enters their login credentials to access Jira |
| View Dashboard | Check updates | User views their personalized dashboard to check for updates on their projects |
| View Projects | Check updates | User views their projects to check for updates and new tasks |
| Create Issue | Track feedbacks | User creates a new issue to track feedback from stakeholders |
| Assign Issue | Track feedbacks | User assigns the issue to the relevant team member to work on |
| Work on an Issue | Manage changes | Team member works on the issue and updates its status as needed |
| Close Issue | Manage changes | Team member closes the issue once it's resolved |
| View Reports | Manage changes | User views reports on project progress and G-Muds status |
Eisenhower Matrix
With dozens of potential features on the table, we needed a shared framework to cut through the noise. The Eisenhower Matrix gave us a clear, objective lens to decide what to build first — and what to leave for later.
- Integration with Itaú's systems
- Task tracking and assignment
- Issue creation and management
- Analytics and metrics
- Security and data privacy
- Agile teams first
- Customizable workflows
- Design system components
- Real-time collaboration
- Integration with third-party apps
- Advanced search capabilities
- Meetings / Rituals (e.g: Planning)
- Push notifications
- User permissions and access levels
- Exportable reports
- Automated notifications
- In-app tutorials and help center
- Blog center
- Internal social media sharing
- Dark mode
- Gamification features
- Chatbot integration
- Emoji reactions
- Mobile access
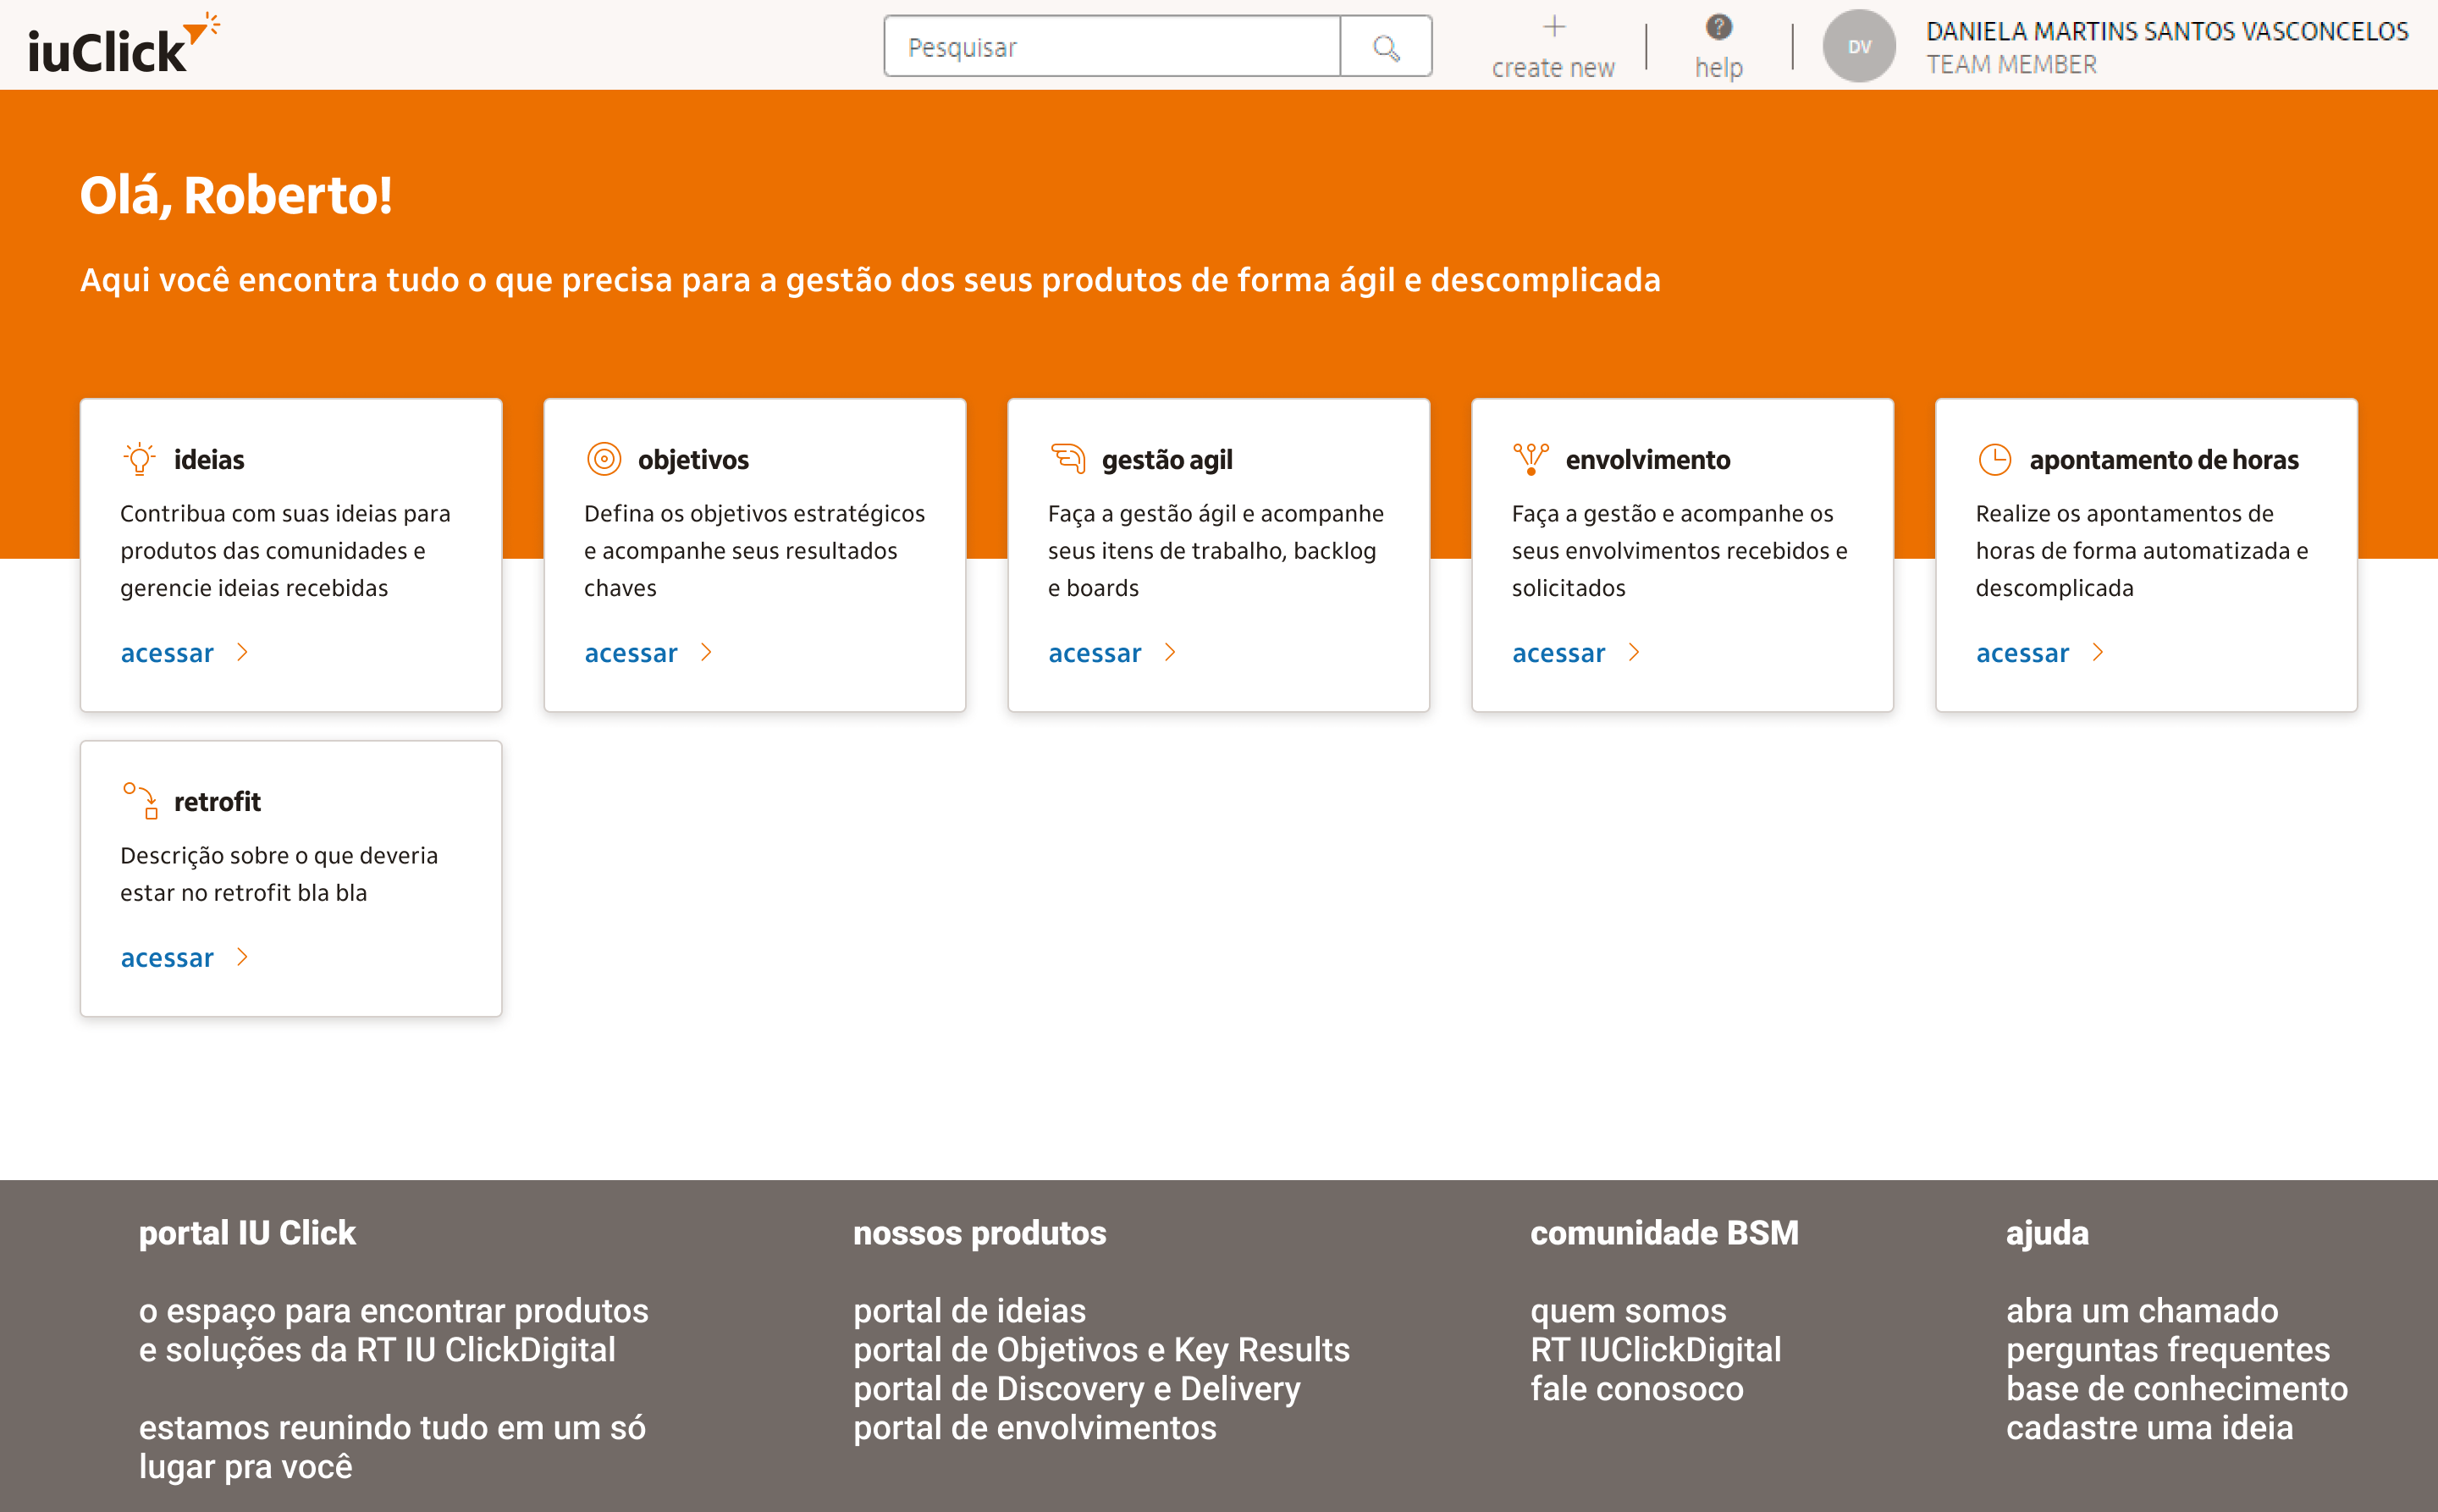
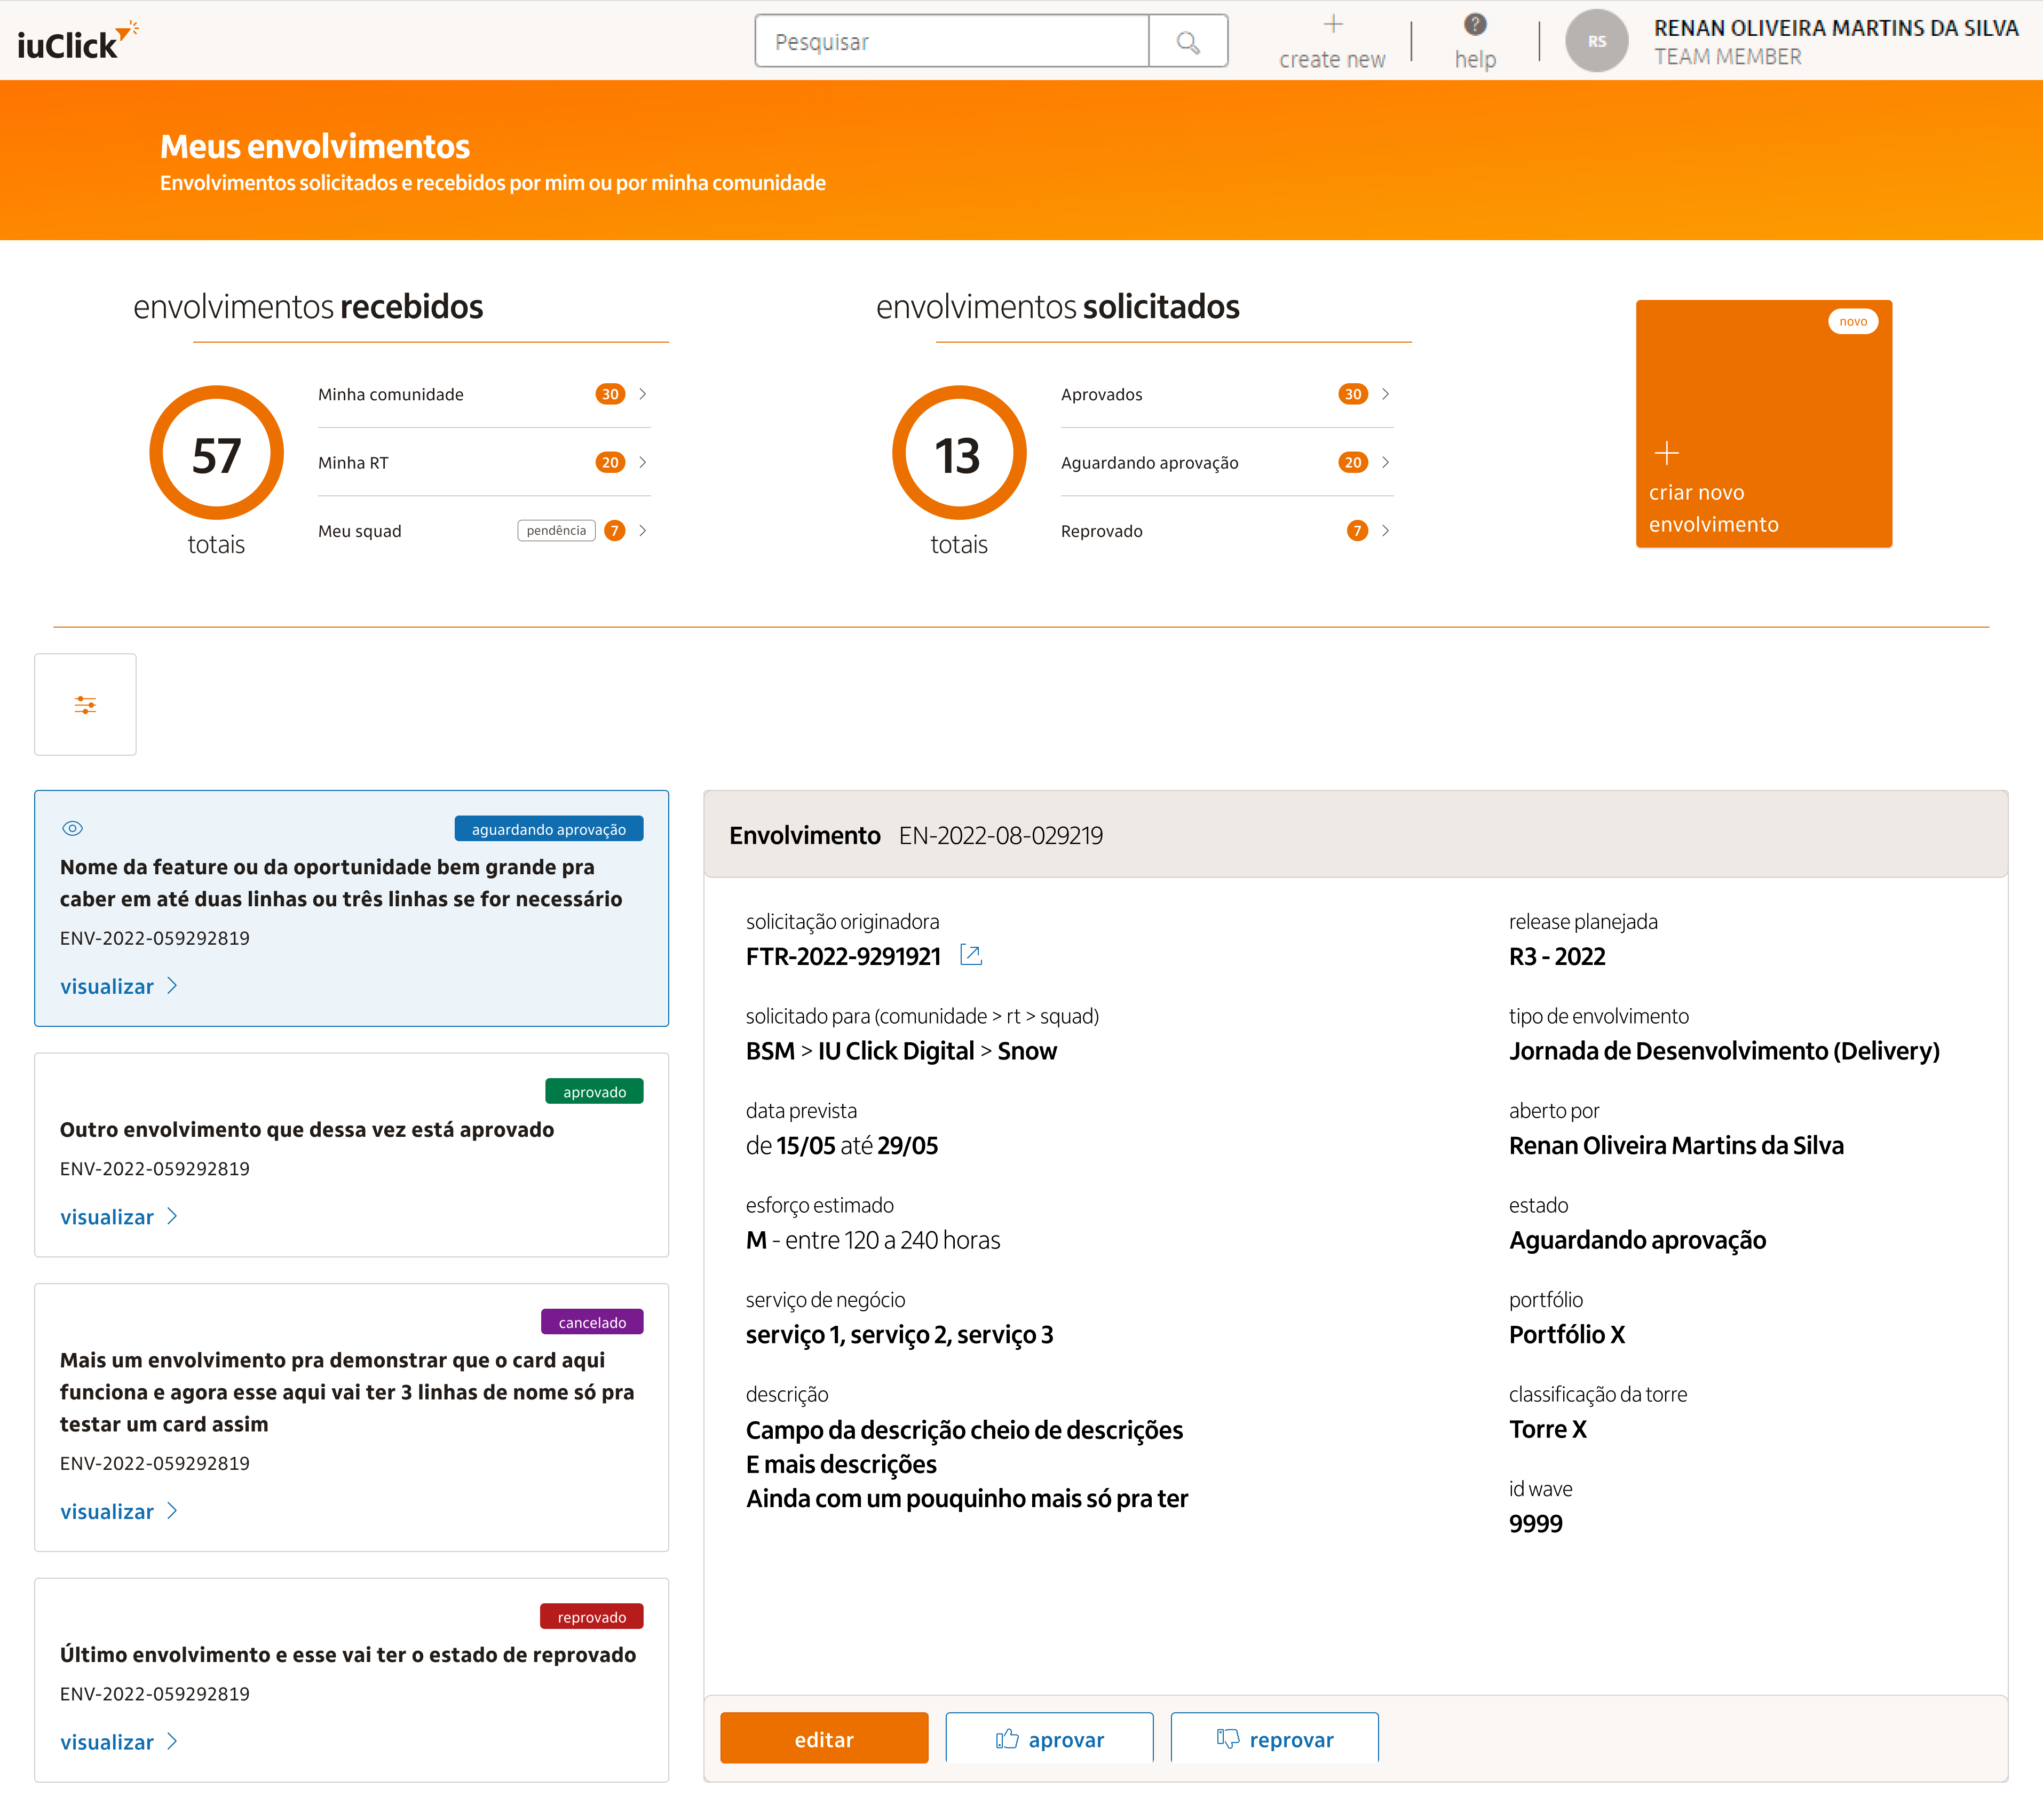
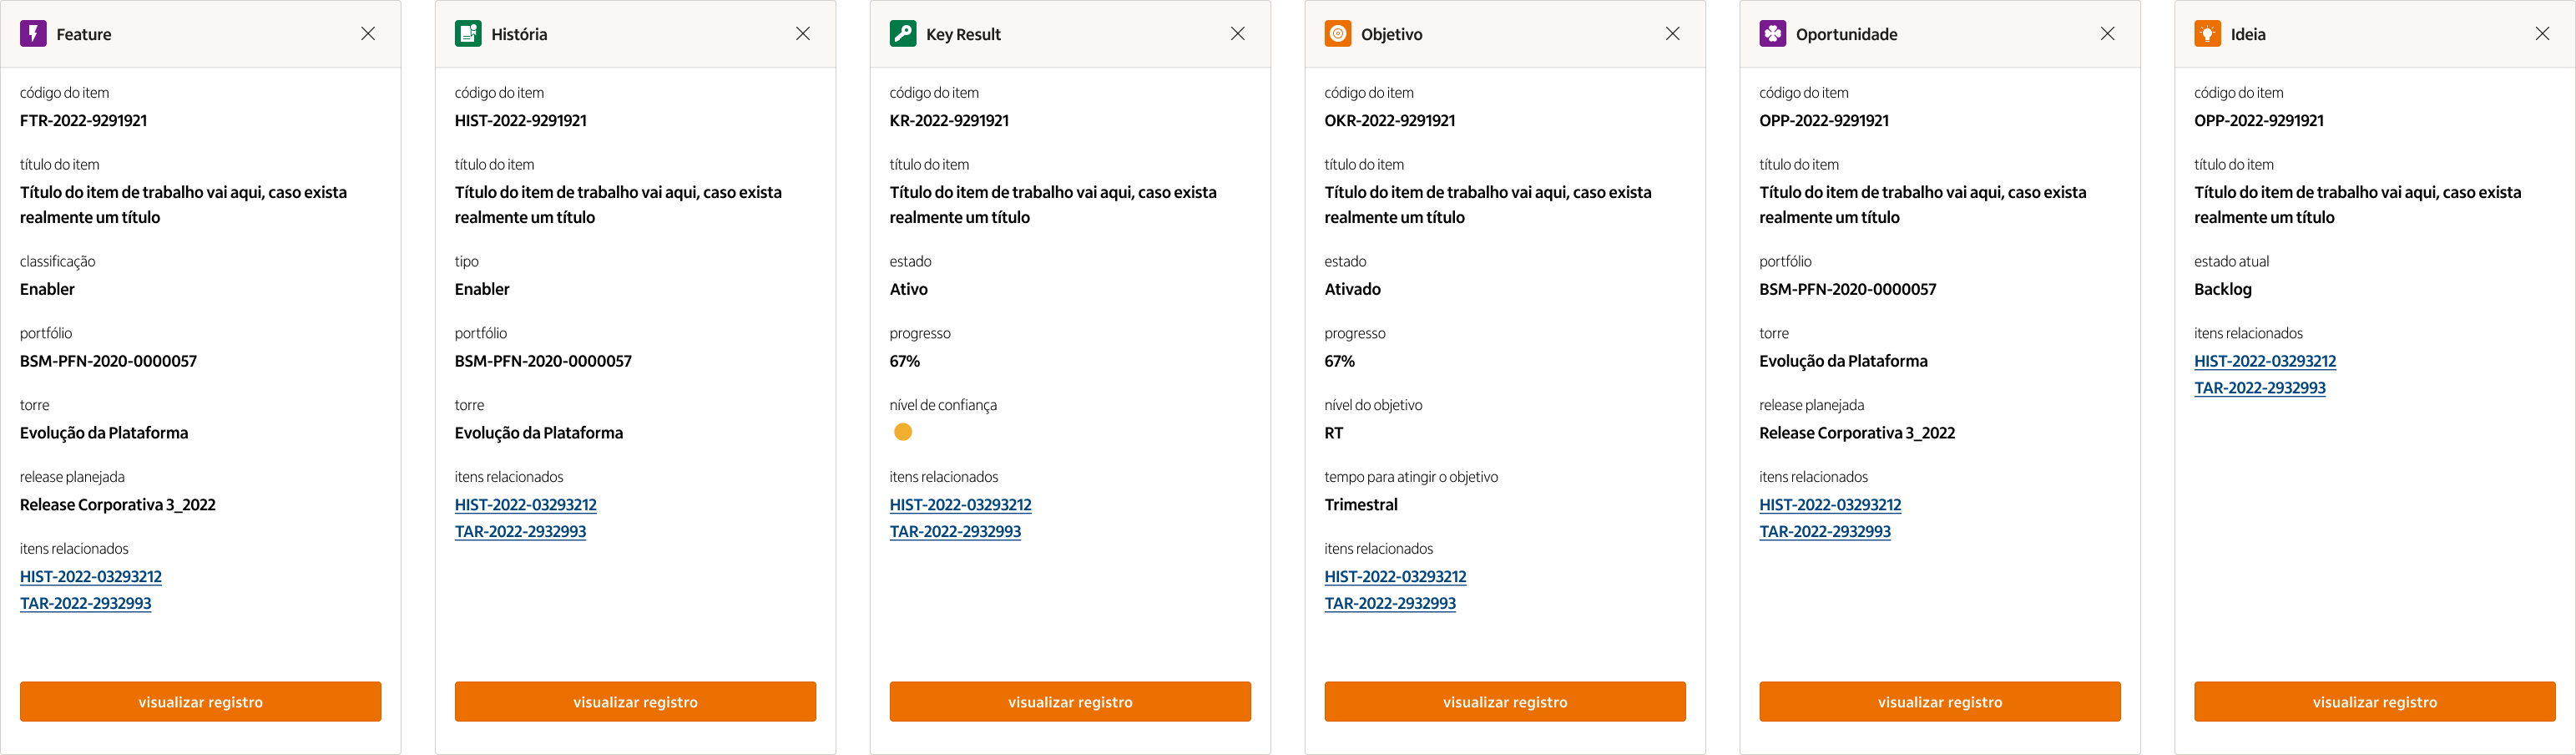
IU Click Pocket — designed for Itaú
Built around four core experiences that addressed every pain point we uncovered — from onboarding friction to lack of visibility over delivery status.
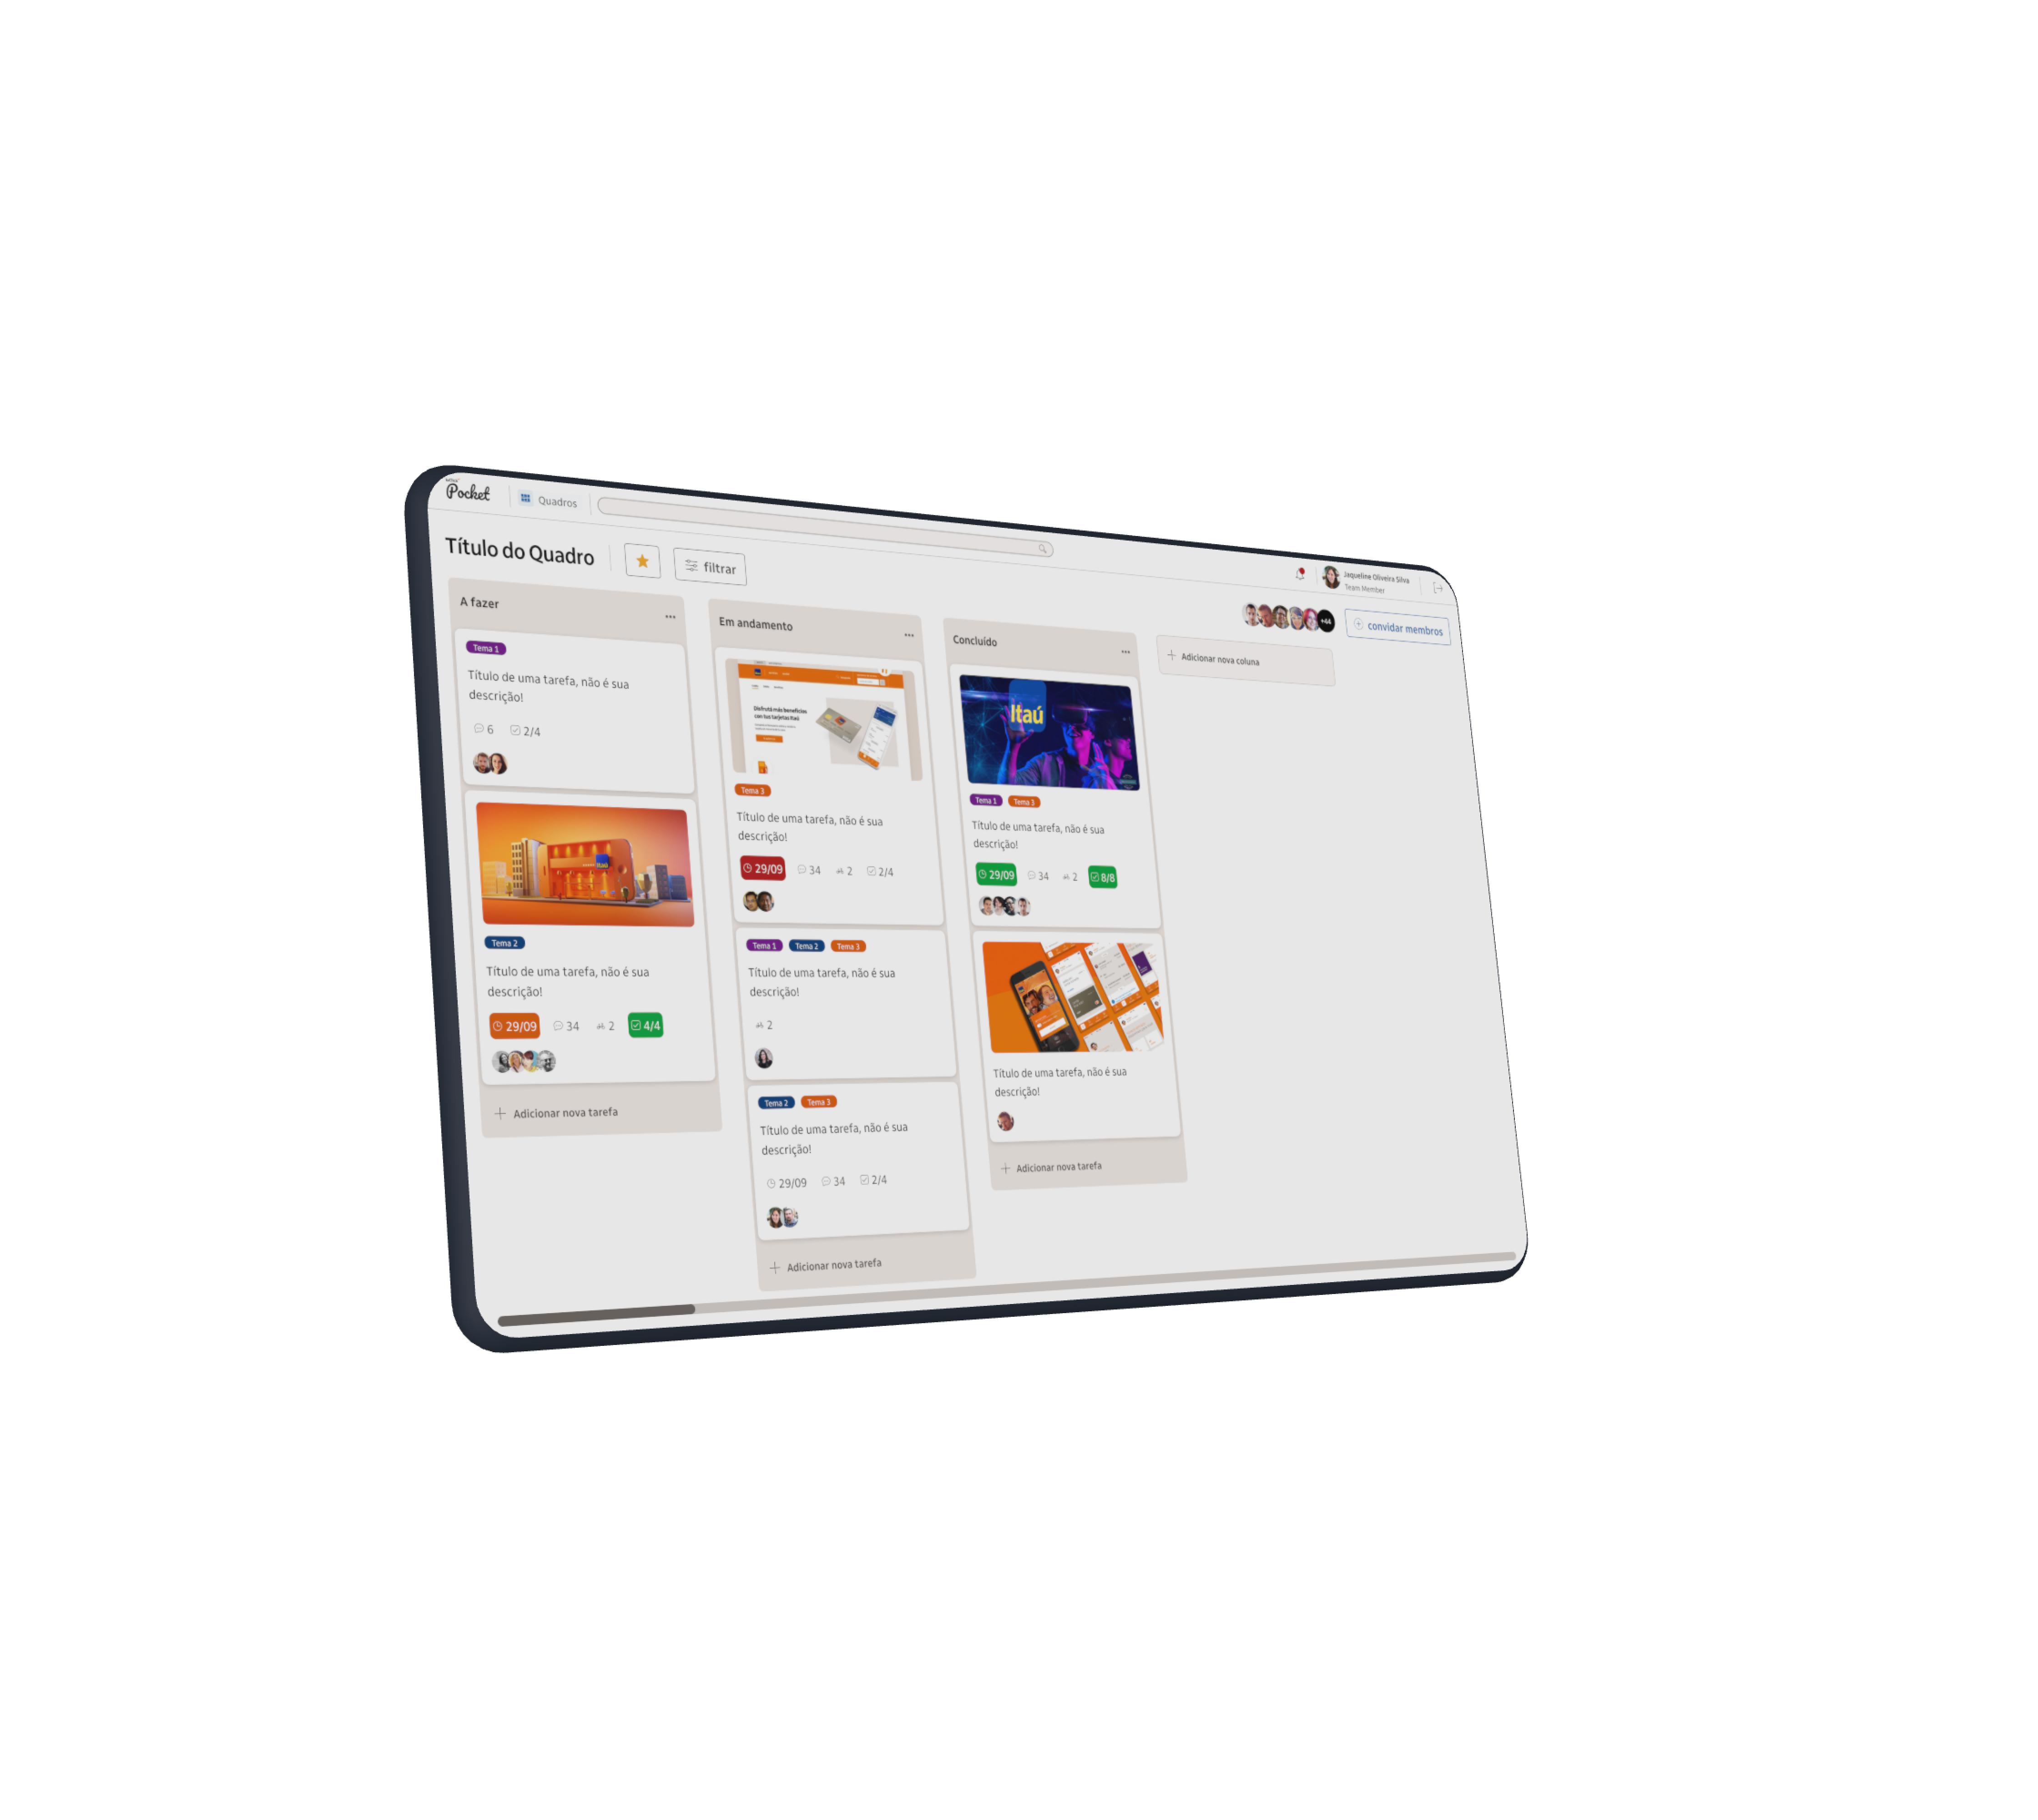
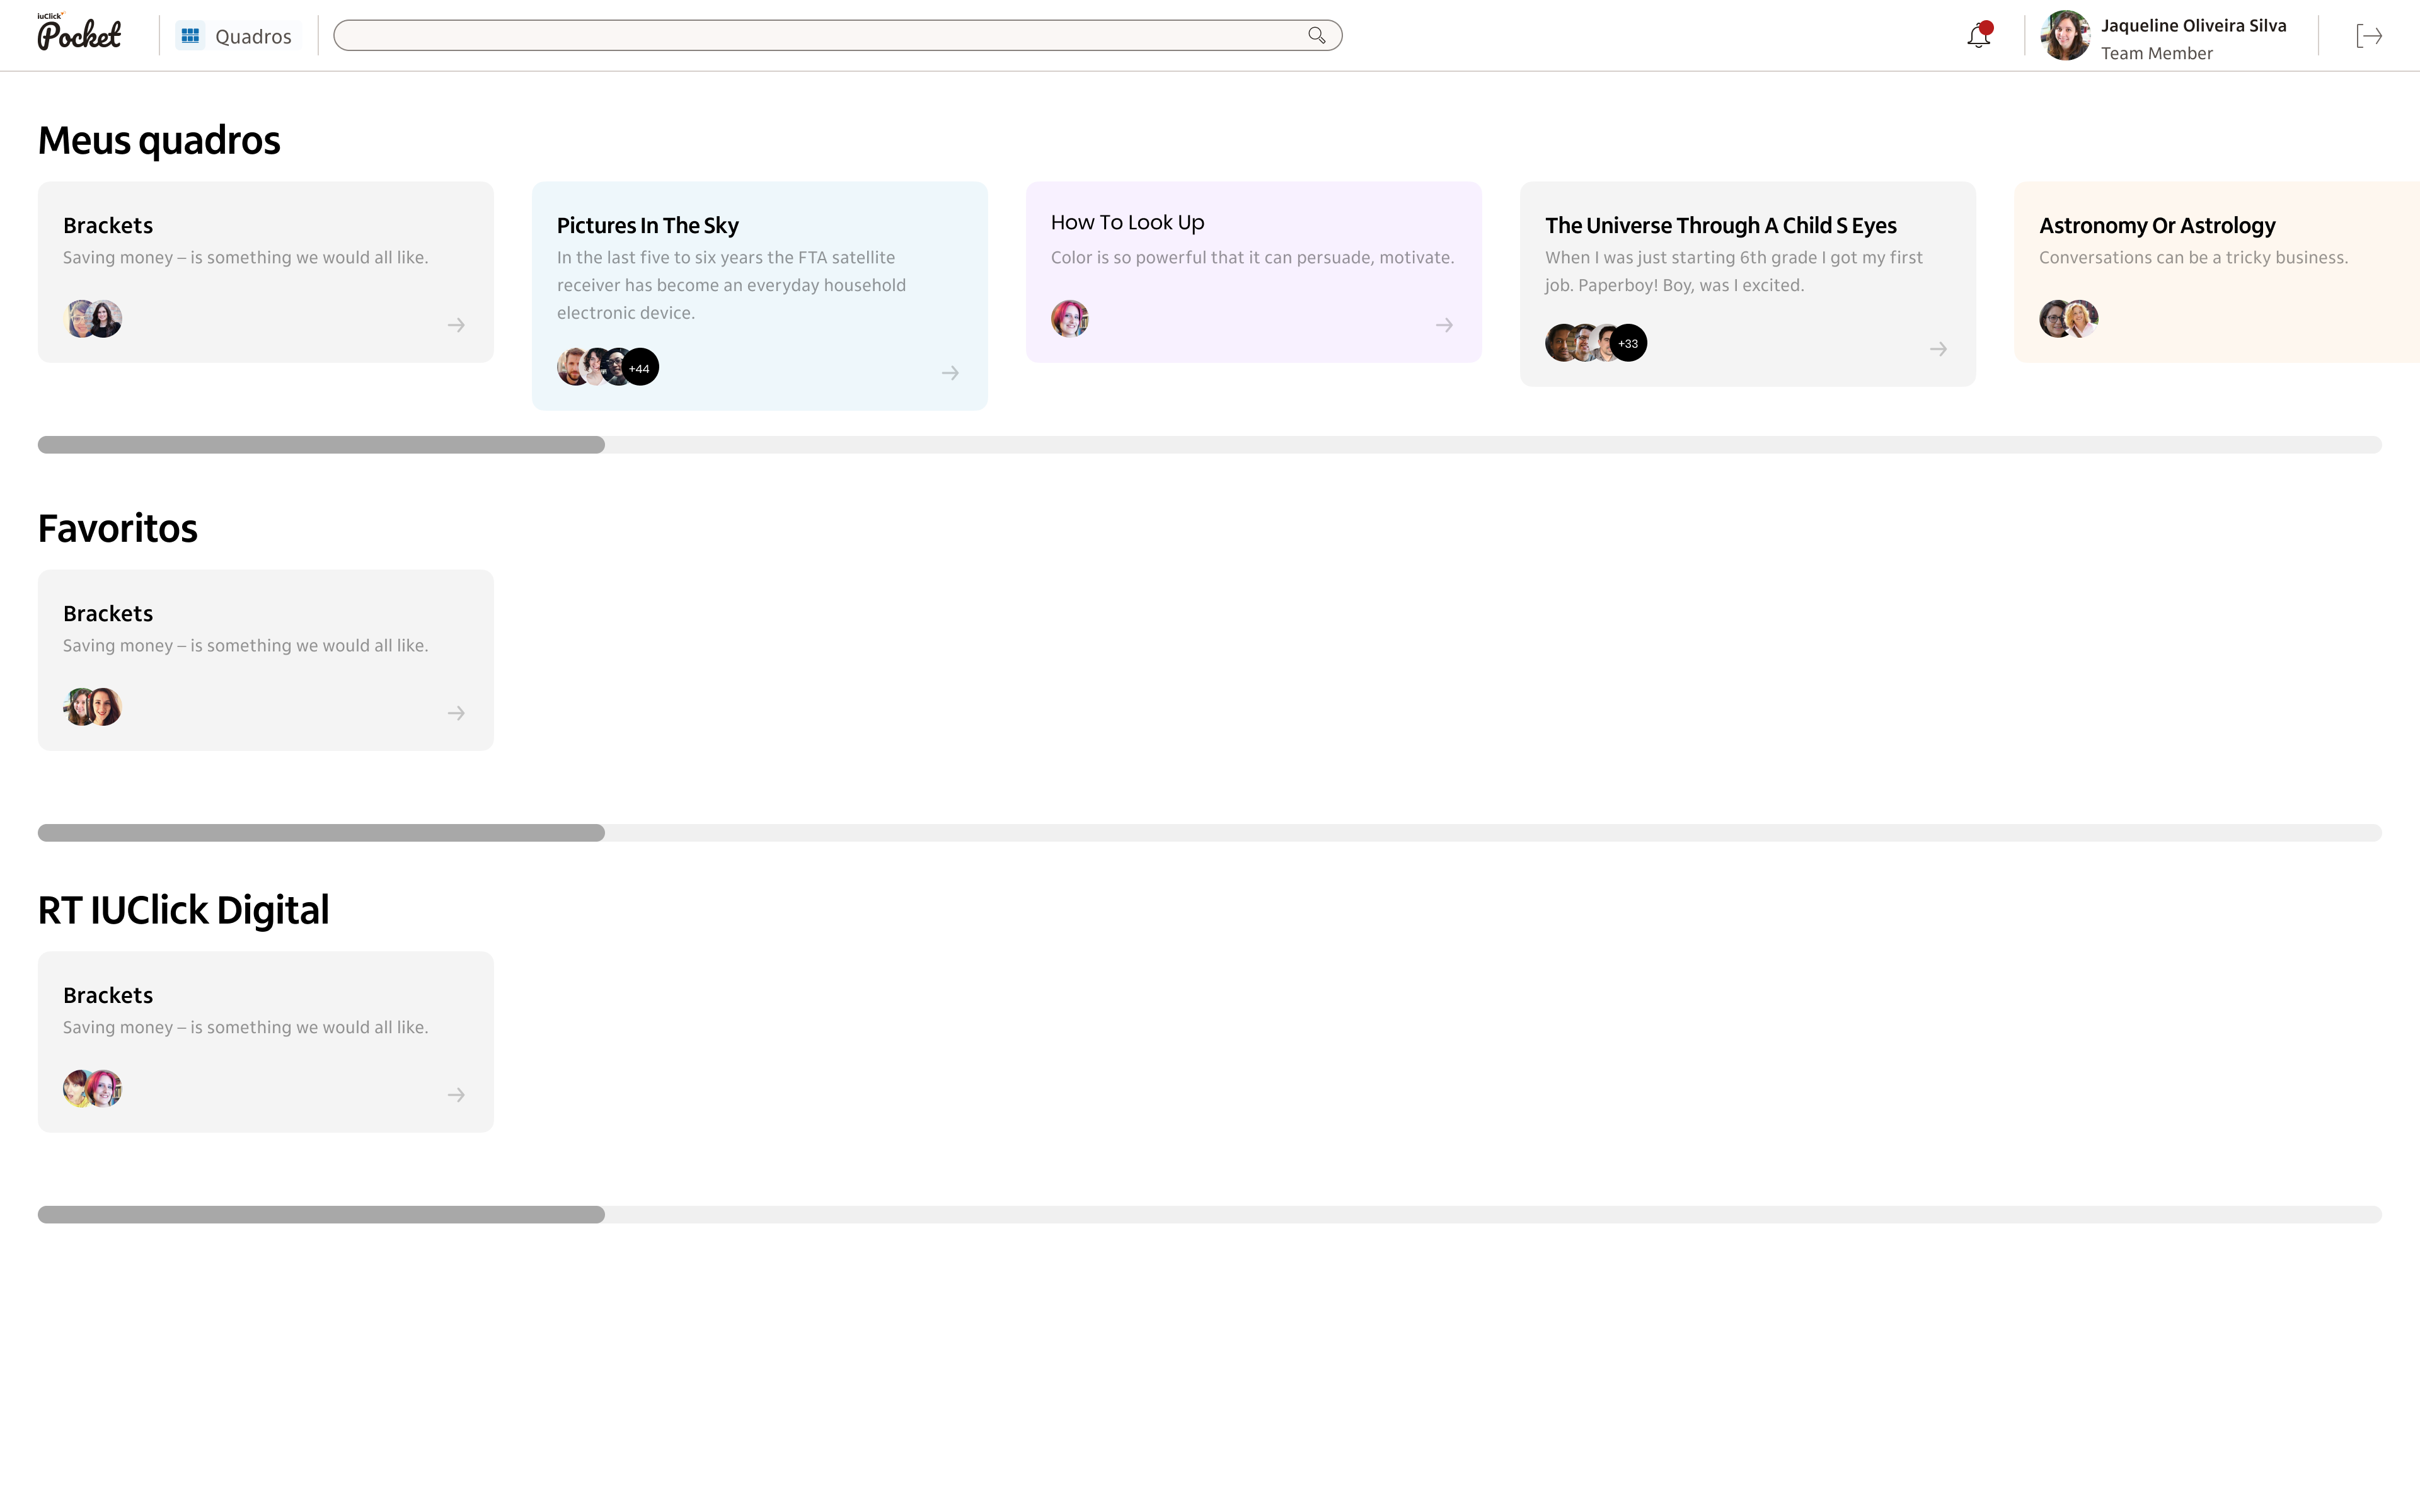
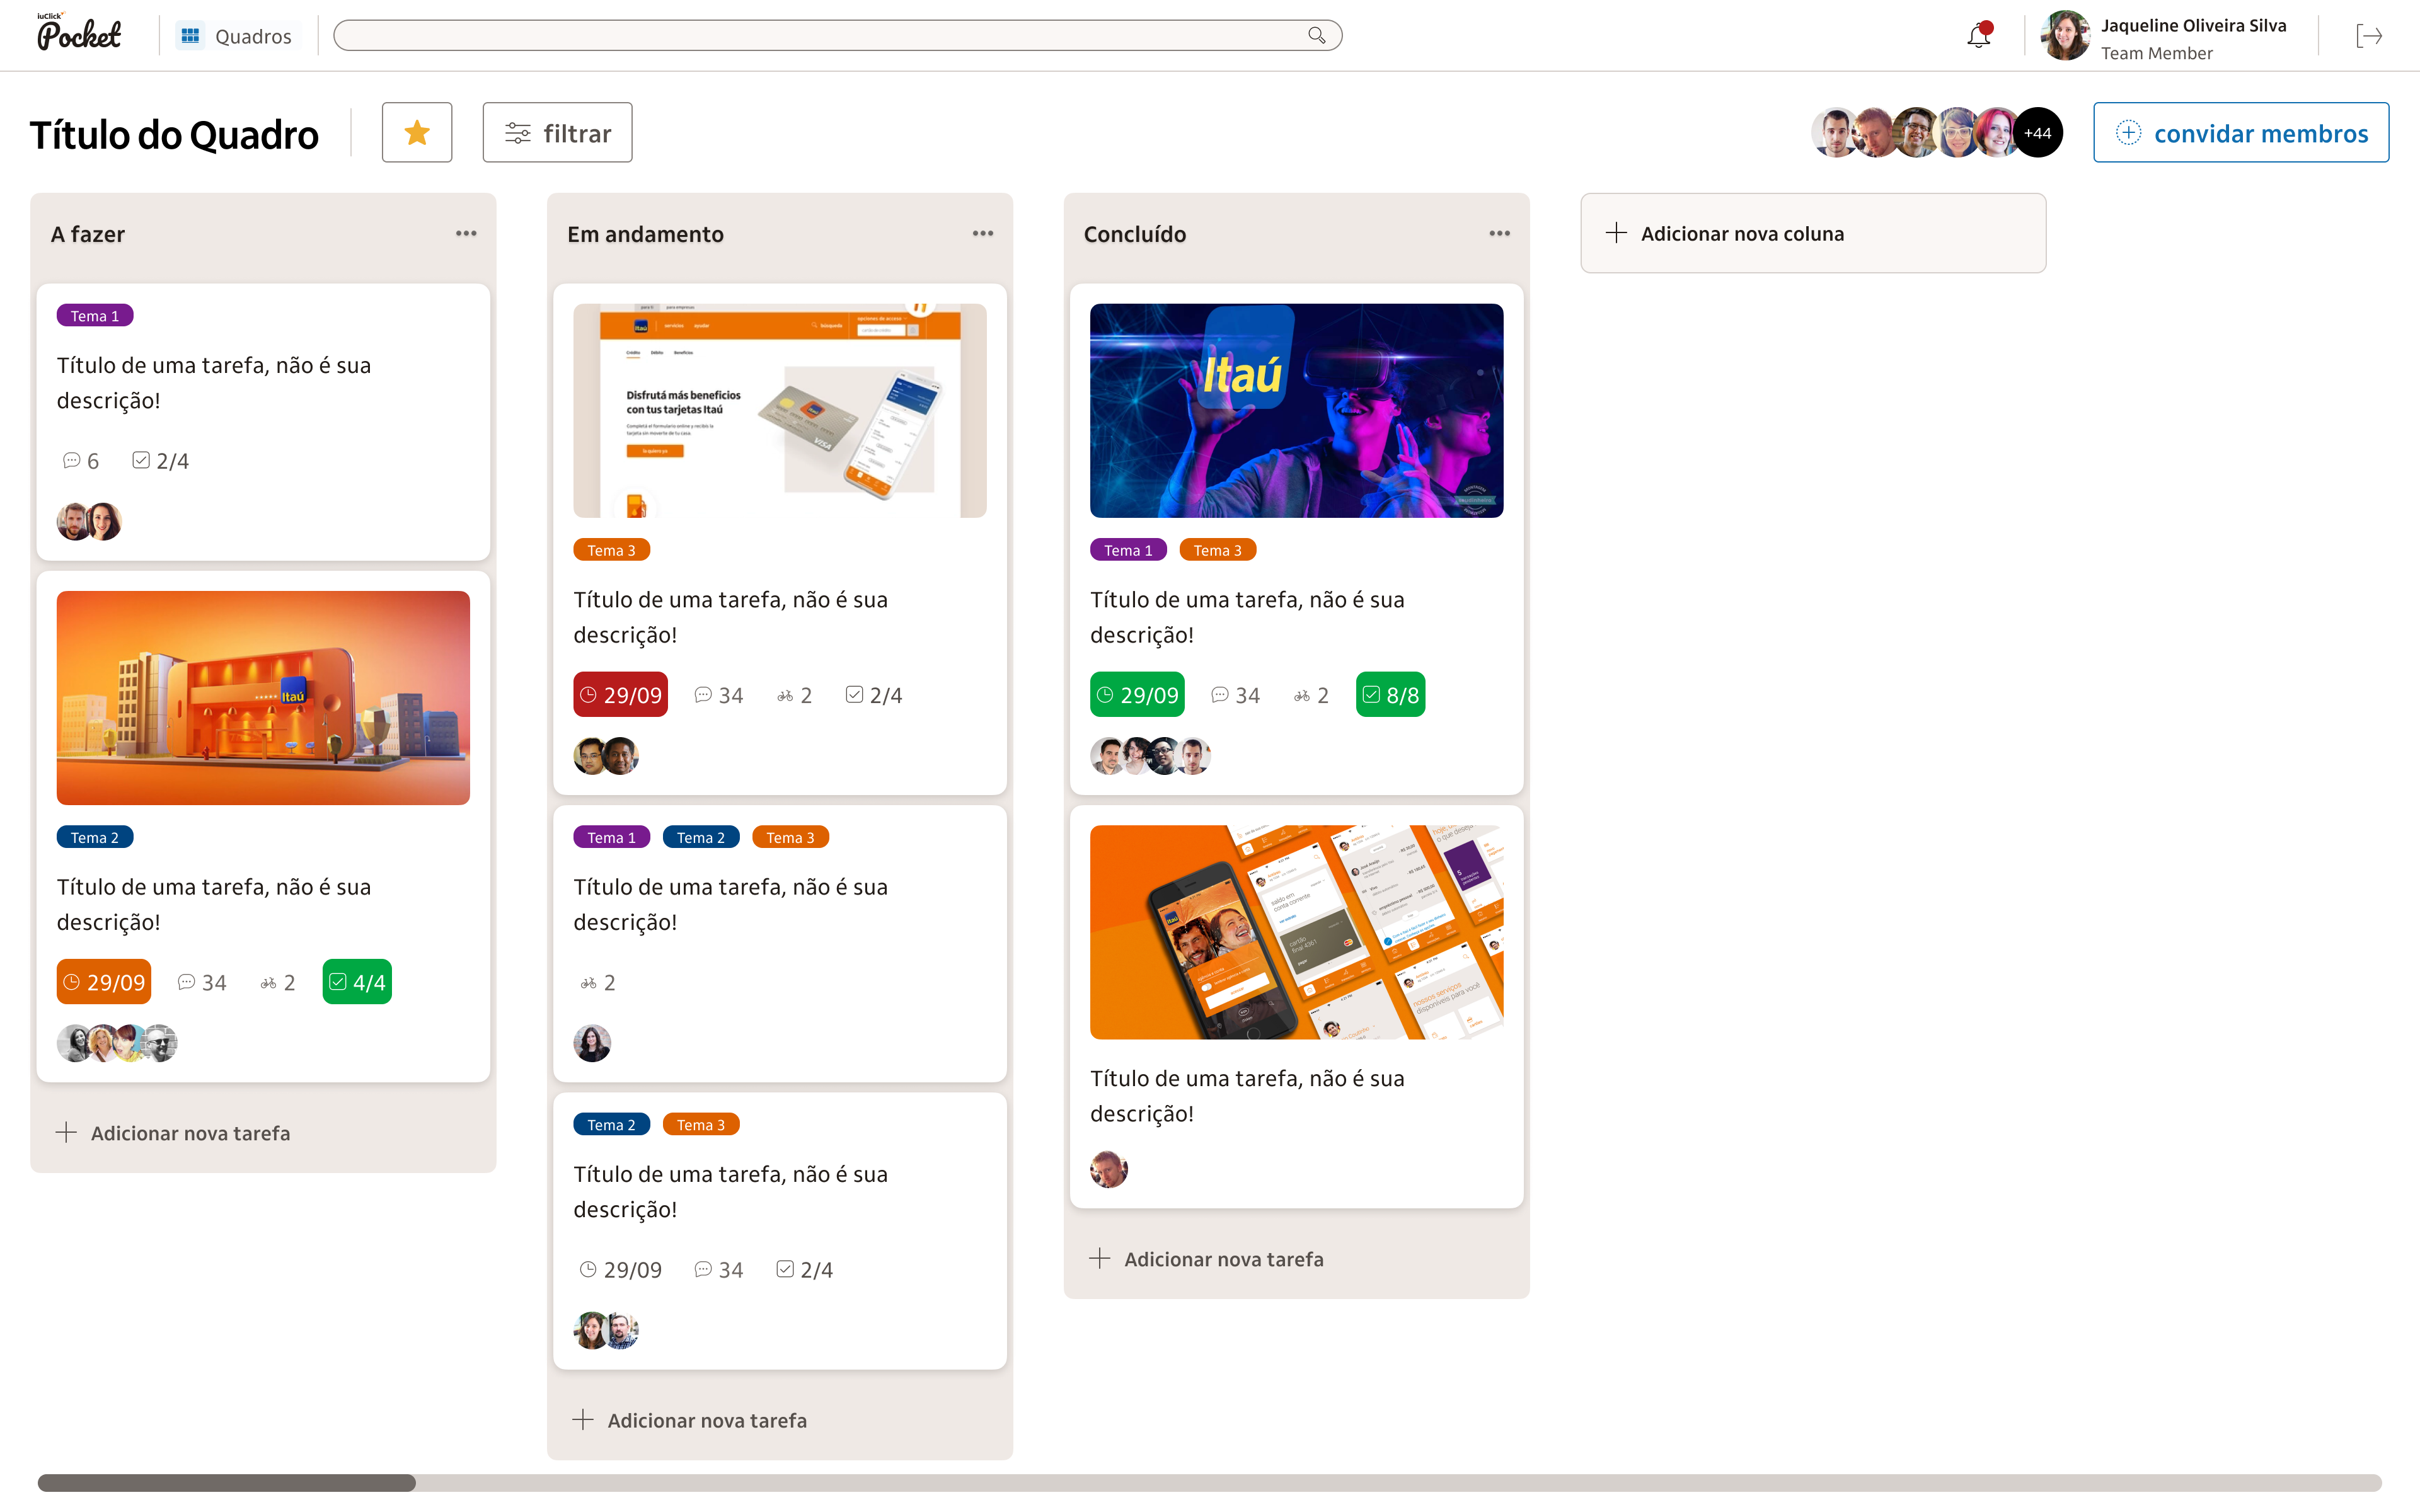
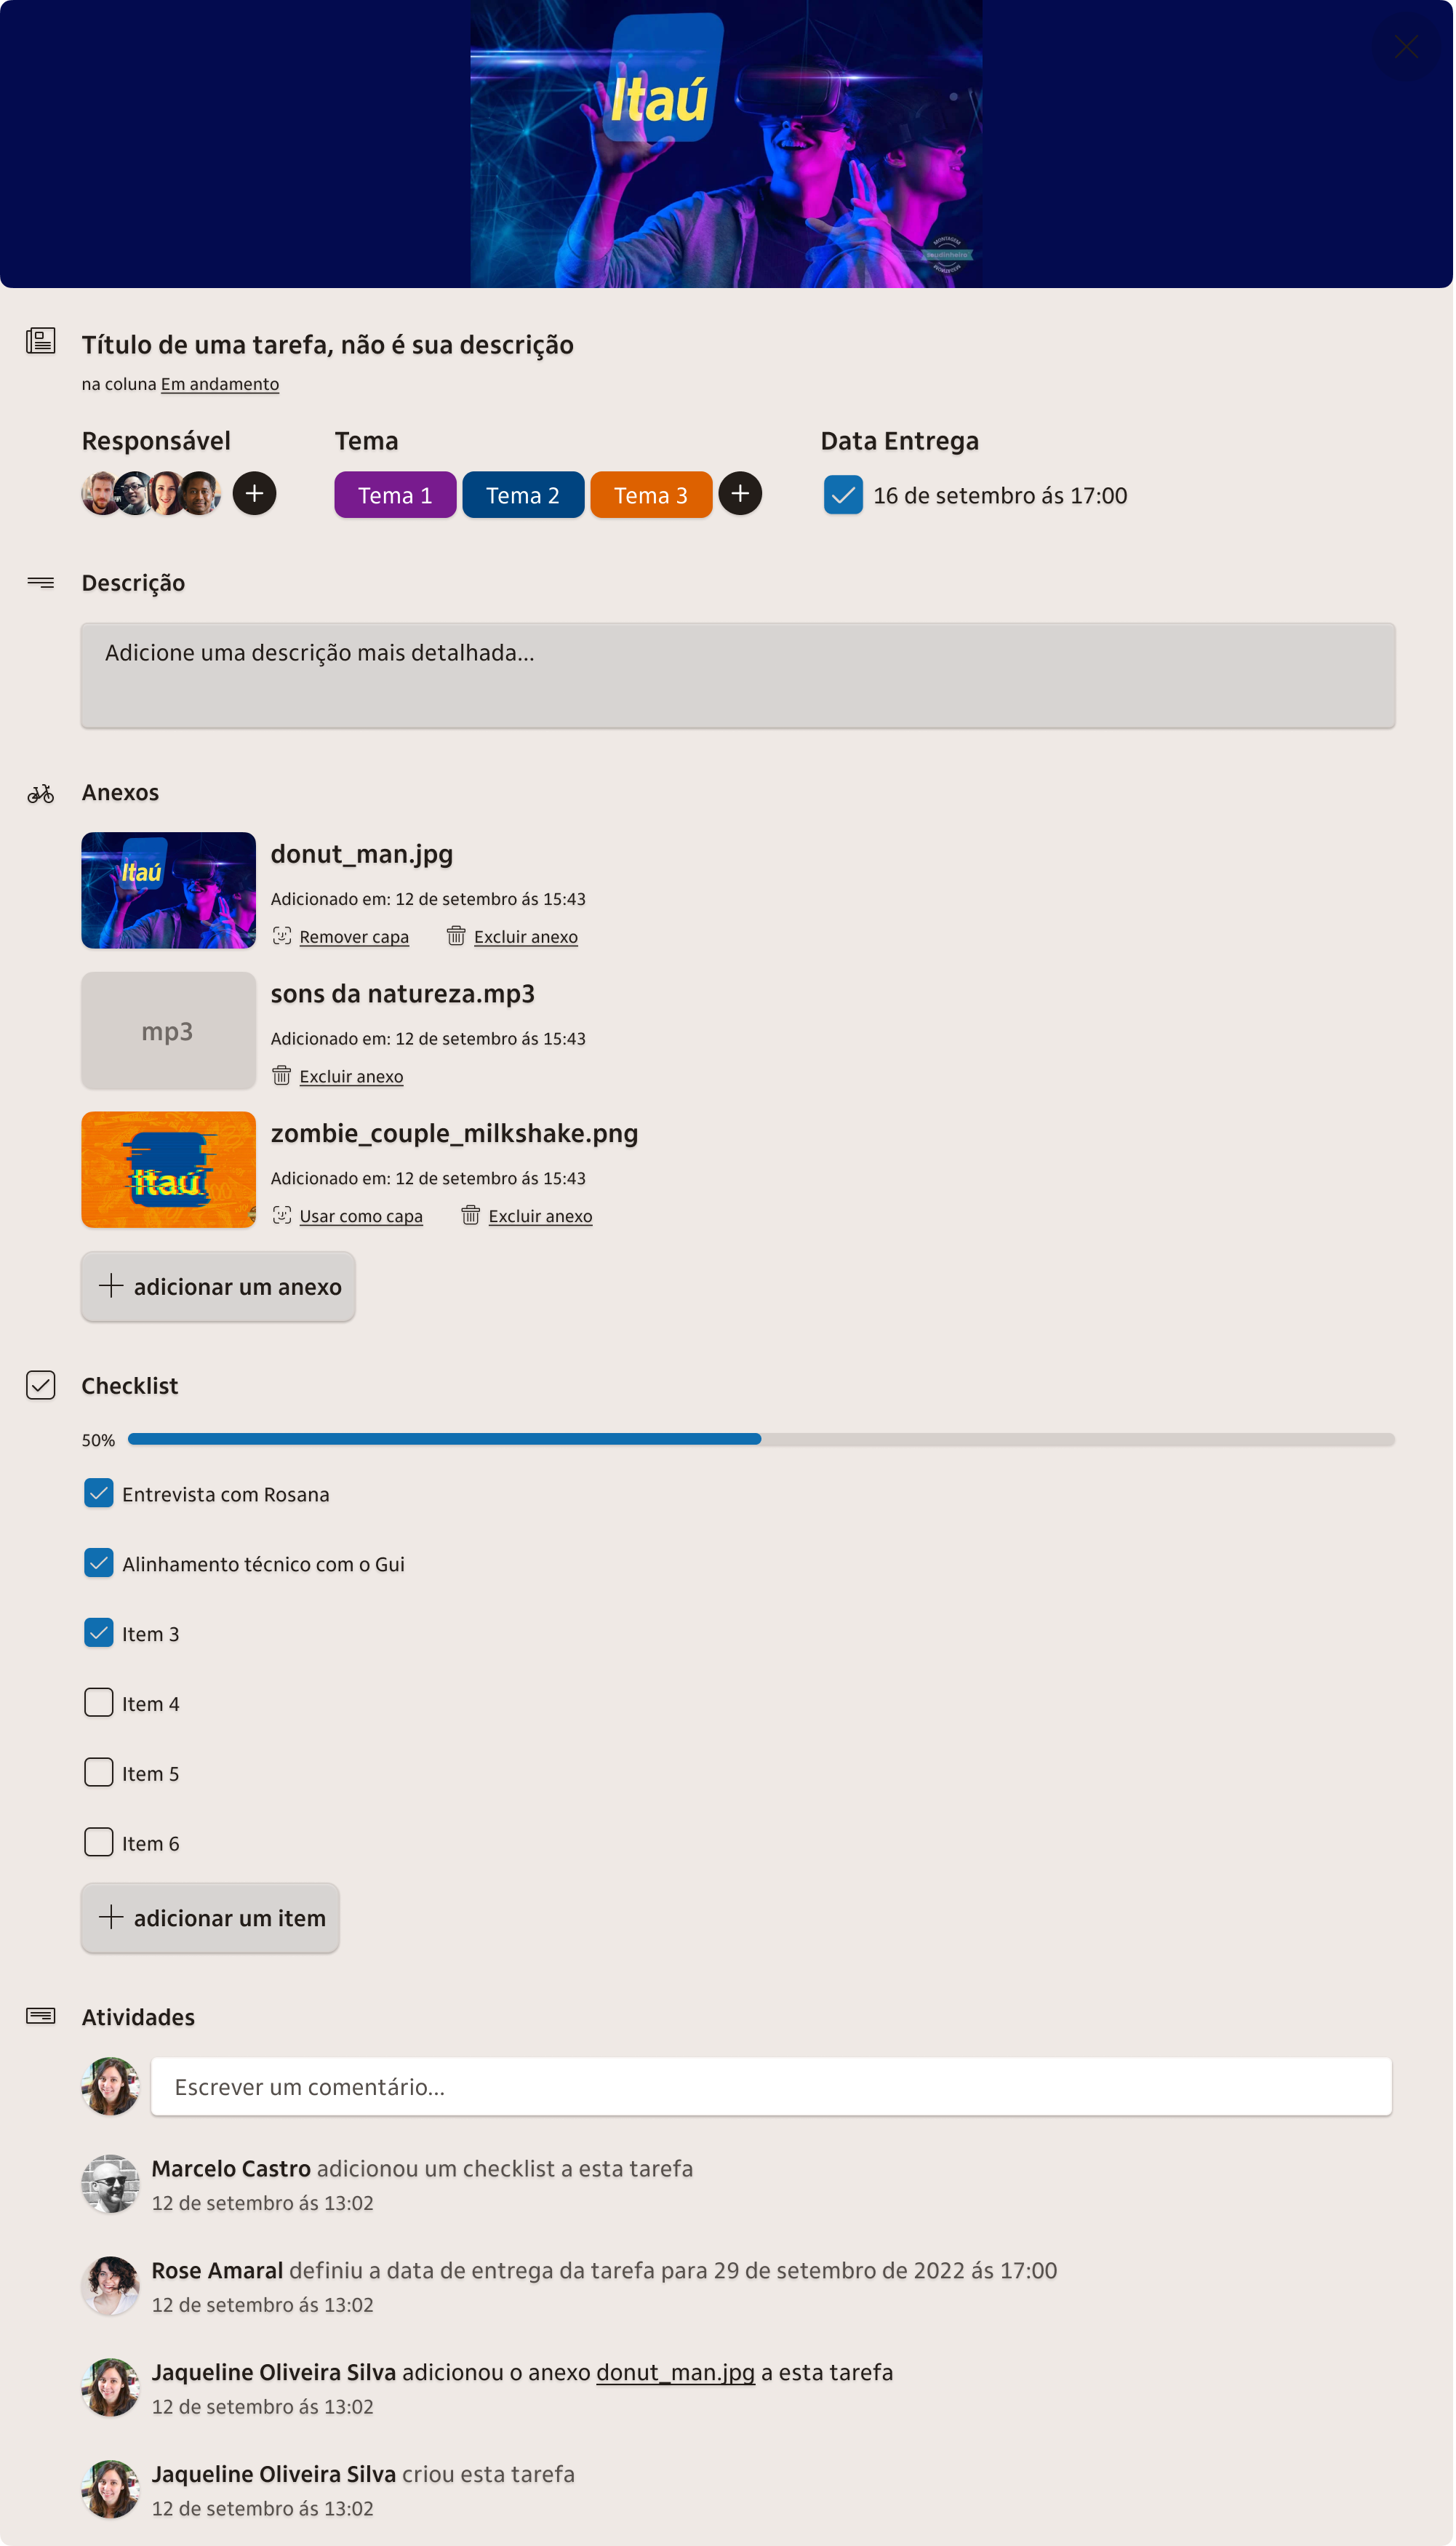
The product in action
Six screens across the platform — from the home dashboard to the board and card detail views.
How I measured success
We adapted Google's HEART framework into a custom model — HUE — tailored to our team's context and project goals.
We conduct usability tests using Maze's app and collect feedback from participants using the System Usability Scale (SUS) across all core flows.
We compare IU Click Pocket's SUS score against Jira's baseline to validate that the new product delivers a meaningfully better usability experience.
Once a satisfactory SUS score is achieved, we go live and continuously deliver updates, using Google Analytics for behavior and Hotjar for heatmaps and targeted surveys.
Achieving SUS 81 means IU Click Pocket ranks in the top tier of usability research benchmarks — a score that cleared the bar to proceed to production release with zero regressions.
Likert scale surveys on tool experience and daily usage. Complemented by NPS and qualitative feedback from 500+ participants.
Product usage: 3.85 → 4.36
Maze usability tests measuring task completion rates, error rates, and time-on-task across all core flows before going to production.
Google Analytics for behavior patterns. Hotjar heatmaps and surveys to identify friction and preferred features post-launch.
What I took
away from this
Building an internal tool from zero at a company the size of Itaú Unibanco is a lesson in navigating complexity without losing sight of simplicity. Our biggest win wasn't the product — it was proving that a focused team could ship something 500+ colleagues preferred over a market-leading tool.
The HUE framework taught me that adapting existing measurement systems to your context isn't a shortcut — it's a strength.
Research doesn't have to be elaborate to be powerful. 500 surveys + behavioral data revealed what months of assumptions never would have.
The board was where users lived. Instead of designing 20 features adequately, we designed one surface exceptionally — and it made all the difference.
An SUS score of 81 isn't the end — it's the start. Real value comes from continuous delivery informed by actual usage data.